[b] Plot the spectral density, D[], for a fixed value of & and several different values of T. (Put these all on the
same plot, carefully labeling everything.) These plots should make clear that a finite lifetime, 1, implies a finite
line width--i.e. a spectrum that peaks at & but is spread out in a Gaussian-like distribution around this energy
as shown below./nKDmax
A
SE
Dmax
2
Verify that the width of the distribution, is equal to 1/7 at the half-height of the peak. This is typically inter-
preted as the range of energies that you might expect to measure in an experiment. It implies that
τ δε = 1.
(4)
This is called the Lifetime Broadening Relation, and it should call to mind the time-energy uncertainty relation.
Explain what the LB Relation says about the certainty with which you can know the excited state energy as a
function of the lifetime of the excited state. Look at the two extremes, zero lifetime and infinite lifetime, to help
elucidate the physics.

Fig: 1
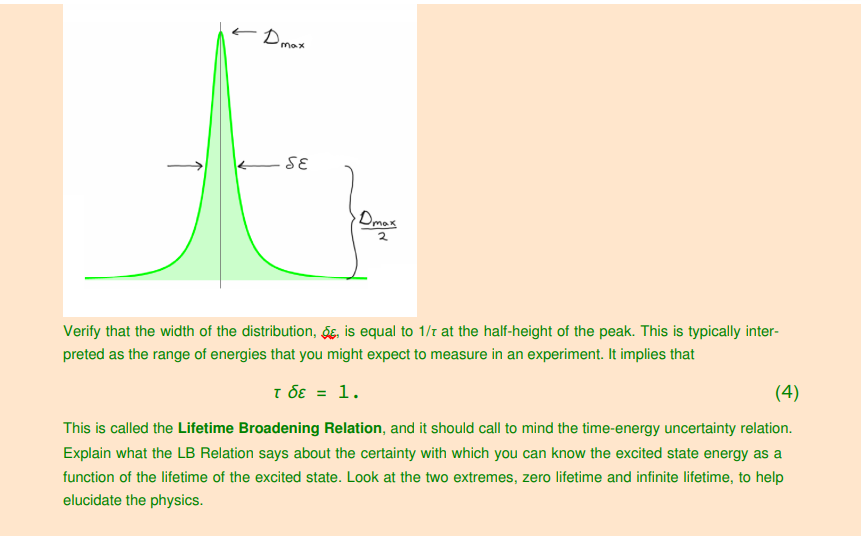
Fig: 2